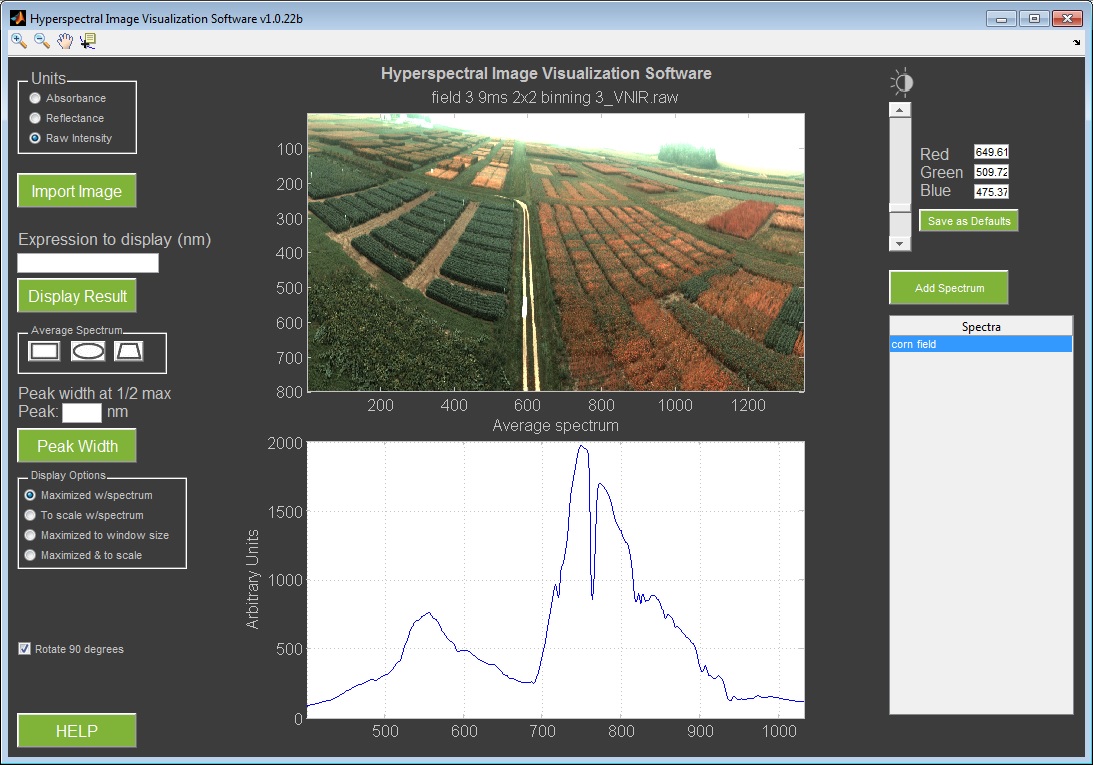
Hyperspectral imaging applications produce massive amounts of data which require the right software tools for analysis. Before digging into the complex algorithms and chemometric analyses, however, it is useful to visualize and explore the data a bit.
At MSV, we do sample measurements for a wide range of applications to check out whether a problem might be solved with hyperspectral imaging tools. Because we were looking at so many images, we came up with a set of commonly used exploration tools that aided our own image analysis, and put these tools together in the Hyperspectral Image Visualization Software.
This software started as an internally-used tool. It is a simple, but highly useful program that allows the user to check for saturated pixels, proper focusing, and to ensure the target sample was measured completely.
We expanded the use of the visualization software to show current and prospective users results during product demonstrations. Feedback from these product demos made it clear that this can be a very useful tool for anyone working with hyperspectral data. We have since added new features such as the ability to add or subtract spectral bands and view the resulting image.
Check out the webpage to learn about more of the features.
